BNPPF Private Wealth Defensive

General info

Summary Risk Indicator
Asset allocation
Issuers
SFDR disclosure information
SFDR disclosure information
The EU Sustainable Finance Disclosures (SFDR) regulation requires disclosure about the proportion of sustainable investments, investments aligned with environmental or social characteristics, and other assets in the portfolio.
Source: Morningstar/Sustainalytics or product manager
Sustainability strategies used
Sustainability strategies used
A sustainable financial portfolio should make use of 4 strategies:
- ESG integration
- Normative screening
- Exclusion
- One main additional strategy
The first 3 strategies ensure the portfolio does not finance activities that pose significant harm to sustainability factors. The additional strategy supports the ESG characteristics or the sustainable objectives the portfolio wants to achieve, and it can have varying degrees of selectivity or focus:
- Best-in-class/universe selection
- Sustainability themed investing
- Impact investing
- Do better than a benchmark on one or more ESG indicators
- Other strategy that results in favouring more sustainable issuers in the selection process
In addition, engaging in a dialogue with companies and/or exercising voting rights in the investee companies is strongly encouraged, especially if the portfolio invests in high-risk sectors such as textile, agriculture, etc. For investments in the fossil fuel sector, engagement is mandatory.
-

ESG integration
ESG integration
Each investment is screened for its potential positive or negative impact on sustainability issues like nature, labour conditions and good governance (ESG). Additionally, the possible impact of sustainability events like climate change, social unrest or legal controversies on the performance of the investments, is analysed.
ESG due diligence using the 'double materiality' perspective -

Norms & standards
Norms & standards
Investee companies must not violate high-level normative frameworks like the UN Global Compact, the UN Guiding Principles on Business and Human Rights, the OECD Guidelines for Multinational Enterprises, and the ILO Conventions.
Respect for international norms & standards -

Exclusions
Exclusions
Exclusion of harmful activities such as weapons, tobacco, coal, unconventional oil & gas and laggard oil & gas and electricity utilities.
Exclusion of harmful activities -

Stewardship
Stewardship
Exclusion of harmful activities such as weapons, tobacco, coal, unconventional oil & gas and laggard oil & gas and electricity utilities.
Engaging in a dialogue with and/or exercising voting rights in the companies invested in -

Other ESG strategy
Other ESG strategy
Another way to favour more sustainable issuers in the selection process, if recognized by the CLA.
Another way to favour more sustainable issuers in the selection process
Exposure to controversial sectors
Exposure to controversial sectors
The score of the product (little triangle) in comparison to the average score of the product category (line with dot)
Tobacco
The portfolio's exposure to tobacco products manufacturing, related products & services, and (wholesale) distribution.
Source: Morningstar/Sustainalytics

Tobacco
Weapons
The portfolio's exposure to military contracting, small arms production, dedicated components & services and distribution.
Source: Morningstar/Sustainalytics

Weapons
Controversial weapons
The portfolio's exposure to military contracting, small arms production, dedicated components & services and distribution.
Source: Morningstar/Sustainalytics

Controversial weapons
Coal
The portfolio's exposure to thermal coal extraction.
Source: Morningstar/Sustainalytics

Coal
Arctic oil and gas exploration
The portfolio's asset-weighted percentage revenue exposure to extraction of tar sands and Arctic oil & gas exploration.
Source: Morningstar/Sustainalytics

Arctic oil and gas exploration
Oil sands extraction
The portfolio's asset-weighted percentage revenue exposure to oil sands extraction.
Source: Morningstar/Sustainalytics
Oil sands extraction
Conventional oil & gas production
The portfolio's asset-weighted percentage revenue exposure to oil sands extraction.
Source: Morningstar/Sustainalytics

Conventional oil & gas production
Non-renewable energy generation
The portfolio's asset-weighted percentage revenue exposure to utilities that generate electricity by burning coal, oil or natural gas.
Source: Morningstar/Sustainalytics

Non-renewable energy generation
Nuclear energy generation
The portfolio's exposure to nuclear power generation.
Source: Morningstar/Sustainalytics

Nuclear energy generation
Adverse impact indicators
Adverse impact indicators
The score of the product (little triangle) in comparison to the average score of the product category (line with dot)
Corporates
Carbon Footprint
The amount in tonnes per million (Euro) invested for the Greenhouse Gas (GHG) scope 1 and 2 emissions that are attributable to the portfolio. The amount of emission of GHG (in tonnes) divided by the amount invested (in Euros) is known as the Carbon footprint of a portfolio. Calculated by working out for each unique holding the percentage of that company that the portfolio owns. The portfolio is therefore responsible for that portion of the company's Green house gas scope 1 and 2 emissions. Then each holdings responsible share of the Green house gas scope 1 and 2 emissions are summed to given an overall emissions in tonnes, divided by the millions (Euro) invested in total in those companies. This only includes the long portion of the holdings for which the data is available. The principal adverse impacts (PAIs) are defined by the EU Sustainable Finance Disclosures (SFDR) regulation and are used to measure the adverse impacts of investments.
Source: Morningstar/Sustainalytics

Carbon Footprint
GHG intensity
The weighted average for the portfolio of the underlying holding's Greenhouse Gas (GHG) intensity scope 1 and 2. The average only includes holdings for which the Greenhouse Gas (GHG) intensity scope 1 and 2 are known. It is calculated only on the long holdings portion of the portfolio. The GHG intensity for a company is a measure of it's emissions per million (in Euros) of revenue. The principal adverse impacts (PAIs) are defined by the EU Sustainable Finance Disclosures (SFDR) regulation and are used to measure the adverse impacts of investments.
Source: Morningstar/Sustainalytics

GHG intensity
Fossil fuel involvement
The percentage of the long only portfolio that is exposed to corporations that make any revenue from activities related to Fossil Fuels. The principal adverse impacts (PAIs) are defined by the EU Sustainable Finance Disclosures (SFDR) regulation and are used to measure the adverse impacts of investments.
Source: Morningstar/Sustainalytics

Fossil fuel involvement
Non-renewable energy consumption
The percentage of the long only portfolio that is exposed to corporations that make any revenue from activities related to Fossil Fuels. The principal adverse impacts (PAIs) are defined by the EU Sustainable Finance Disclosures (SFDR) regulation and are used to measure the adverse impacts of investments.
Source: Morningstar/Sustainalytics

Non-renewable energy consumption
Negative effect on biodiversity
The percentage of the long only portfolio that is exposed to corporations that make any revenue from activities that have a negative affect on biodiversity. The principal adverse impacts (PAIs) are defined by the EU Sustainable Finance Disclosures (SFDR) regulation and are used to measure the adverse impacts of investments.
Source: Morningstar/Sustainalytics

Negative effect on biodiversity
Emissions to water
The amount in tonnes per million (Euro) invested for the emissions to water that are attributable to the portfolio. Calculated by working out for each unique holding the percentage of that company that the portfolio owns. The portfolio is therefore responsible for that portion of the company's emissions to water. Then each holdings responsible share of the emissions to water are summed to given an overall emissions in tonnes, divided by the millions (Euro) invested in total in those companies. This only includes the long portion of the holdings for which the data is available. The principal adverse impacts (PAIs) are defined by the EU Sustainable Finance Disclosures (SFDR) regulation and are used to measure the adverse impacts of investments.
Source: Morningstar/Sustainalytics

Emissions to water
Hazardous waste
The amount in tonnes per million (Euro) invested for the hazardous waste emissions that are attributable to the portfolio. Calculated by working out for each unique holding the percentage of that company that the portfolio owns. The portfolio is therefore responsible for that portion of the company's hazardous waste emissions. Then each holdings responsible share of the hazardous waste emissions are summed to given an overall emissions in tonnes, divided by the millions (Euro) invested in total in those companies. This only includes the long portion of the holdings for which the data is available. The principal adverse impacts (PAIs) are defined by the EU Sustainable Finance Disclosures (SFDR) regulation and are used to measure the adverse impacts of investments.
Source: Morningstar/Sustainalytics

Hazardous waste
UNGC principles/ OECD guidelines violations
The percentage of the long only portfolio that is exposed to corporations that have violations of the United Nations Global Compact principles or Organisation for Economic Co-operation and Development (OECD) Guidelines for Multinational Enterprises The principal adverse impacts (PAIs) are defined by the EU Sustainable Finance Disclosures (SFDR) regulation and are used to measure the adverse impacts of investments.
Source: Morningstar/Sustainalytics

UNGC principles/ OECD guidelines violations
Female board members
The weighted average for the portfolio for the percentage of female board members of the underlying holdings. The average only includes holdings for which the percentage of female board members details are known. It is calculated only on the long holdings portion of the portfolio. The principal adverse impacts (PAIs) are defined by the EU Sustainable Finance Disclosures (SFDR) regulation and are used to measure the adverse impacts of investments.
Source: Morningstar/Sustainalytics

Female board members
Sovereigns
Sustainability impact
Impact themes
Impact themes
The percentage of the long only portfolio that is exposed to corporations that make any revenue (>0%) from these 5 impact themes.
Source: Morningstar/Sustainalytics
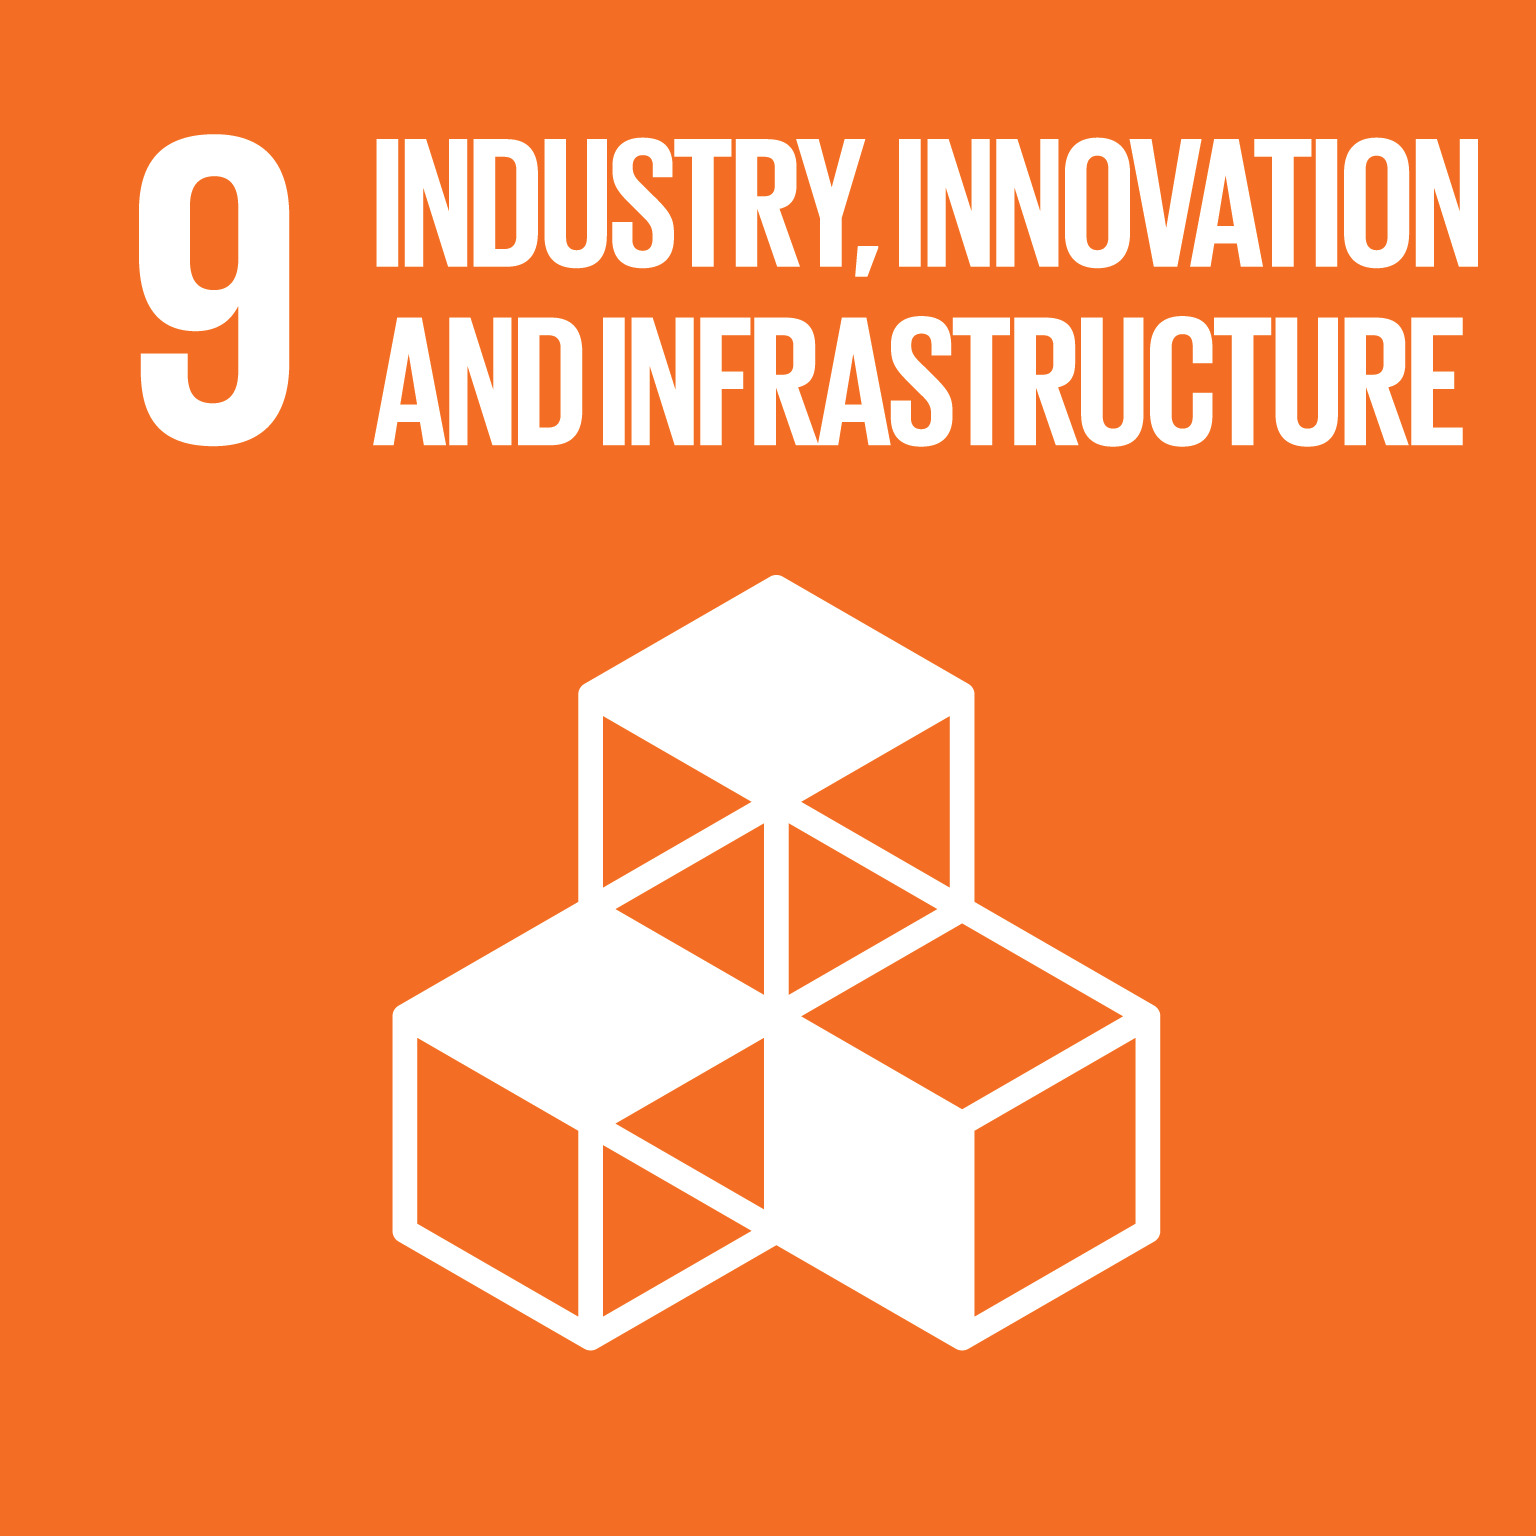
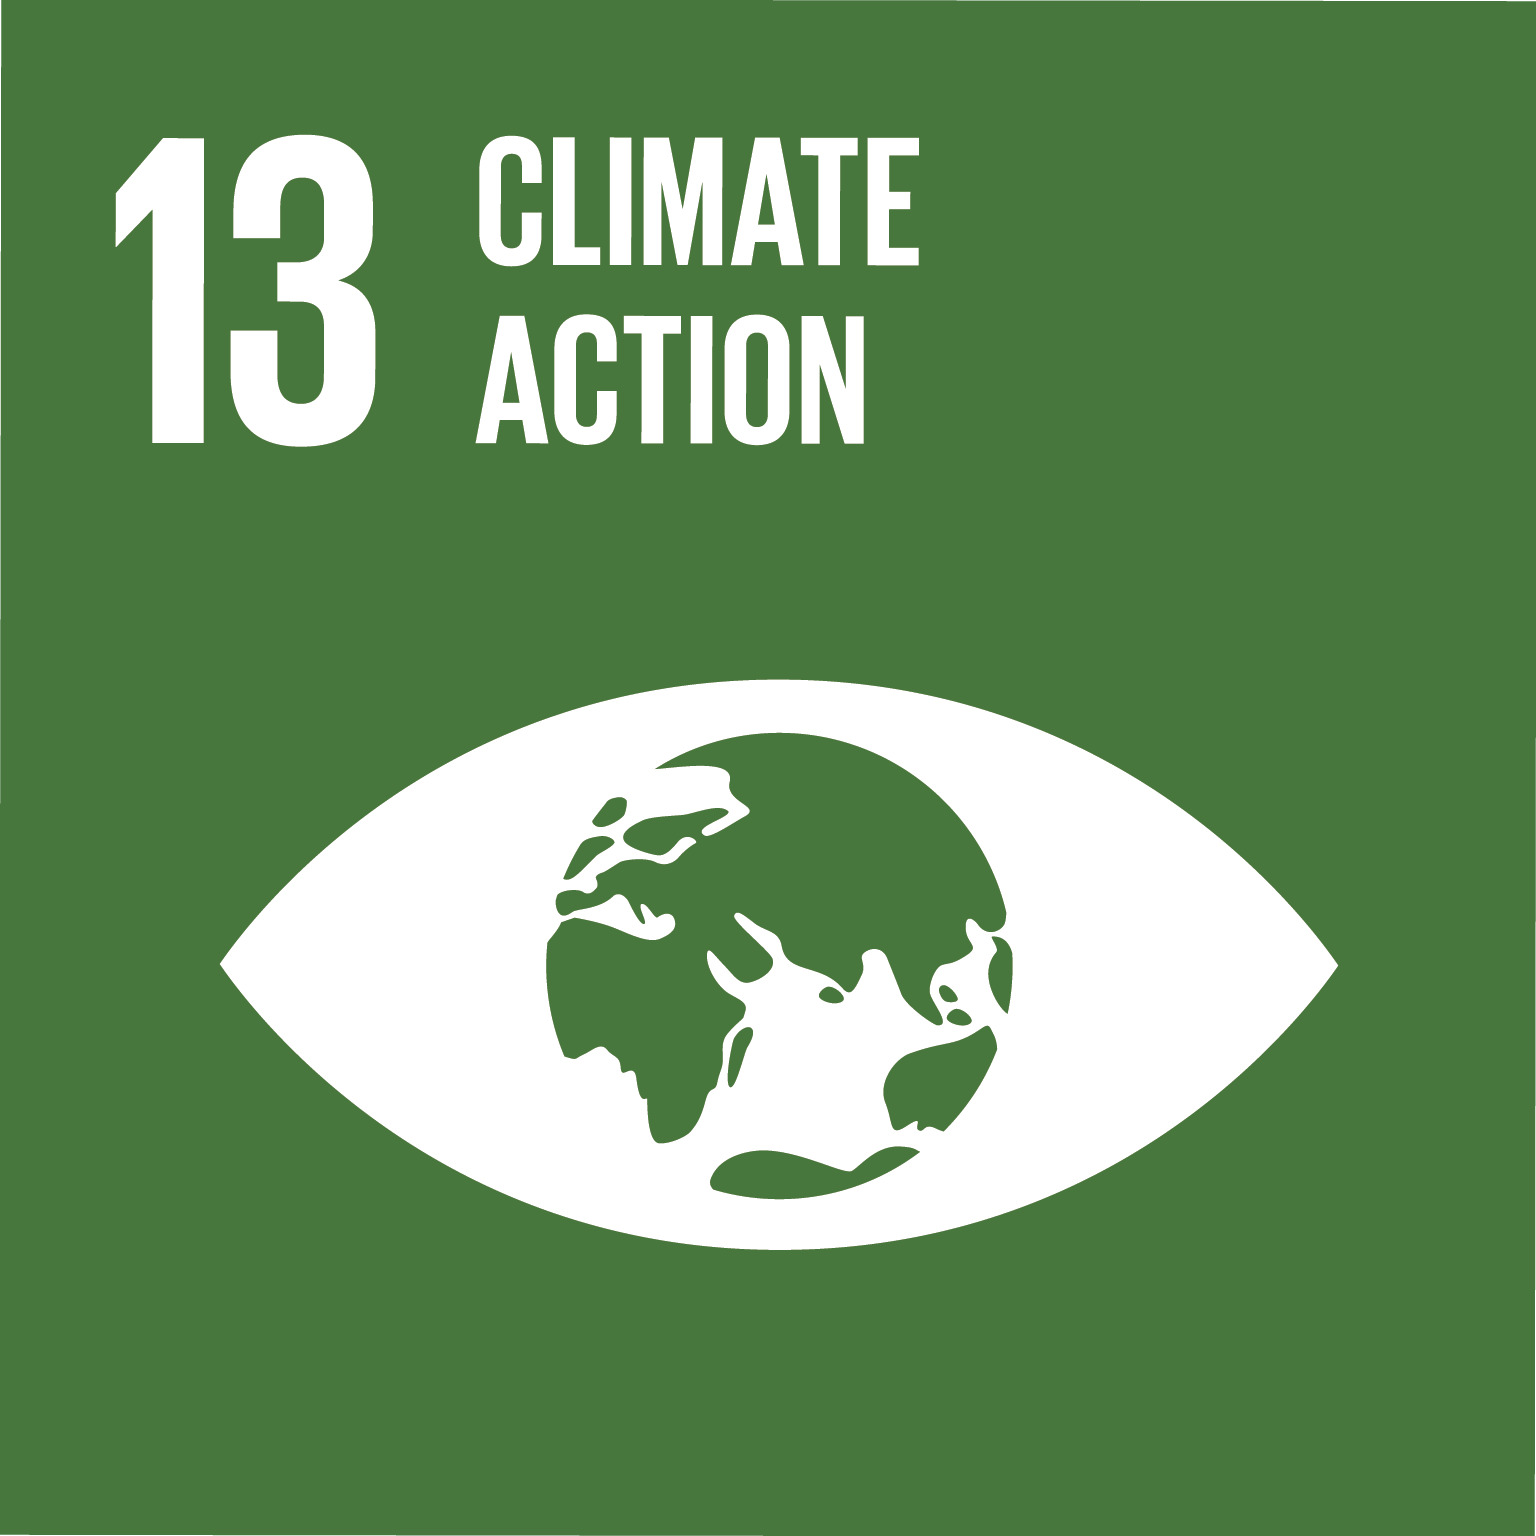
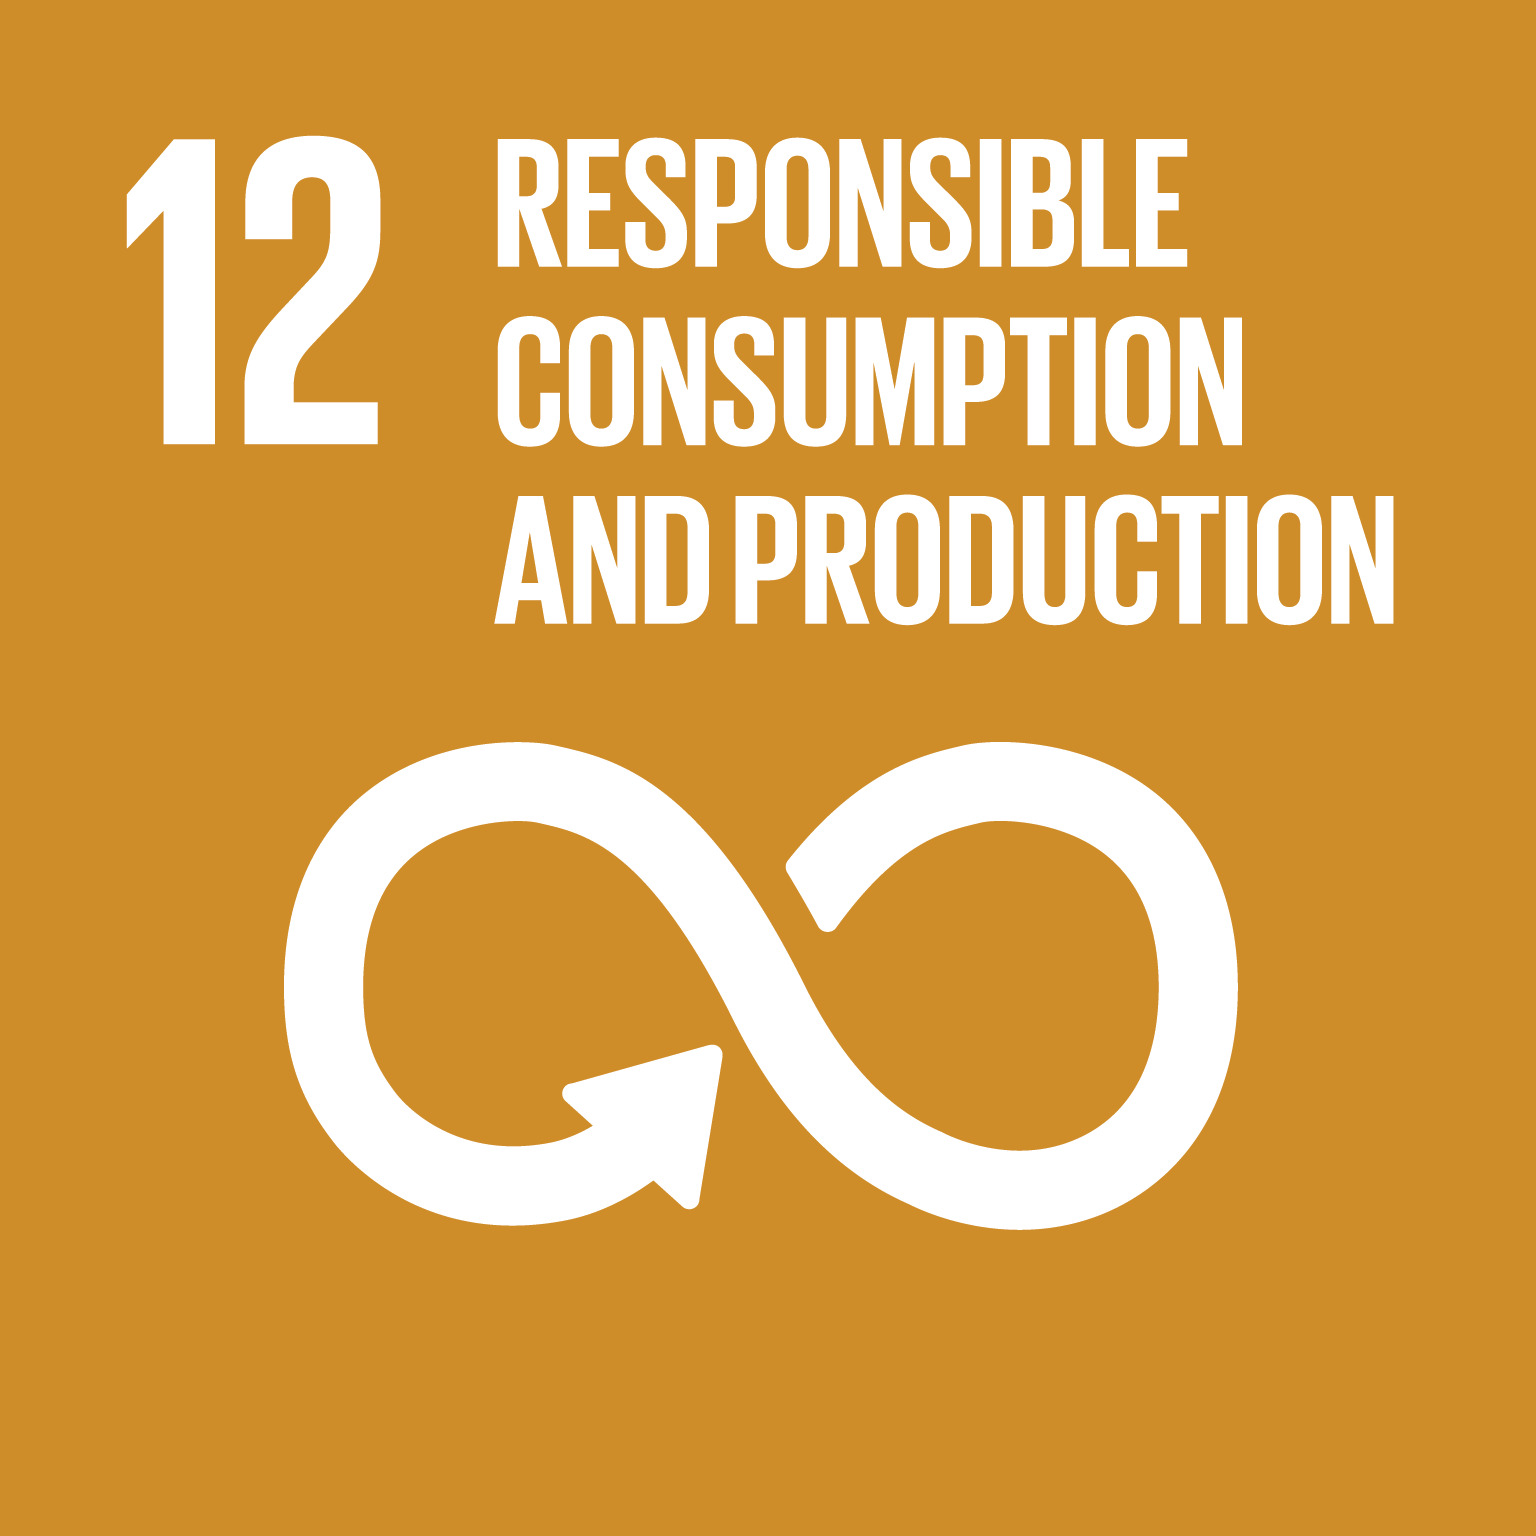
Top 3 SDGs
Top 3 SDGs
The 3 UN Sustainable Development Goals (SDGs) to which the long only portfolio has the highest involvement, measured by exposure to corporations that make any revenue from the SDG.
Source: Morningstar/Sustainalytics
EU taxonomy
EU taxonomy
The EU Taxonomy for sustainable activities is a classification system that translates the EU’s climate and environmental objectives into criteria for specific economic activities. It clarifies which activities are environmentally sustainable, in the context of the European Green Deal. The EU taxonomy aims to prevent greenwashing and help investors make informed sustainable investment decisions.
If data is available, the bar above shows the performance of the product (little triangle arrow) in comparison to the average performance of the product category (line).
EU Taxonomy alignment
The percentage of the long only portfolio that is exposed to economic activities aligned with the EU Taxonomy regulation.
Source: Morningstar/Sustainalytics or product manager
Other portfolio details
| Question | Answer |
|---|---|
| Can derivatives be used in the portfolio management? | |
| Does the portfolio contain use-of-proceeds instruments? | |
| Can the product practice securities lending? | |
| Does the product practice short selling? | |
| Does the product invest in unlabelled underlying products? |
Social violations
The percentage of countries invested in (not percentage of the portfolio) that have social violations as referred to in international treaties and conventions, United Nations principles and, where applicable, national law. This only includes the long portion of the holdings. The principal adverse impacts (PAIs) are defined by the EU Sustainable Finance Disclosures (SFDR) regulation and are used to measure the adverse impacts of investments.
Source: Morningstar/Sustainalytics